Back in the 1940s before the polio vaccine was invented, the disease caused a lot of anxiety among parents of small children. How could you reduce your child’s risk of contracting this nasty illness? Some misguided public health experts apparently recommended avoiding ice cream, thanks to a study that showed a correlation between ice cream consumption and polio outbreaks. This study fortunately was BS. Yes, there was a correlation between ice cream consumption and polio outbreaks, but that was because both were common in the summer months. The authors of the study had mistaken correlation (ice cream consumption and polio are more common at the same time) with causation (ice cream increases your risk of disease).
Medical researchers often trawl through data sets to try and figure out what environmental factors cause chronic disease. Unfortunately, these kinds of studies sometimes make the same kinds of mistakes as the ice cream and polio study. Doctor and researcher John Ioannidis got a lot of people all riled up when he claimed in 2005 that “most published research findings are false“, and as controversial as his main claim might be, he was absolutely right when he pointed out there are some serious problems with the way statistics are often used — and some medical research studies are misleading or flawed as a result. Popular science articles in the media and on the Internet compound this problem by ignoring the limitations of the study they’re reporting. Fortunately you don’t have to be a math major to spot these kinds of problems; just some basic critical thinking skills will do. Here are six ways people sometimes misuse statistics and how to spot them.
1) Assuming correlation = causation.
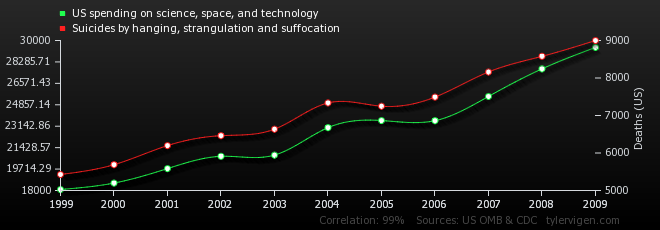
Does spending money on science cause suicide? Clearly it does. Look at the numbers!
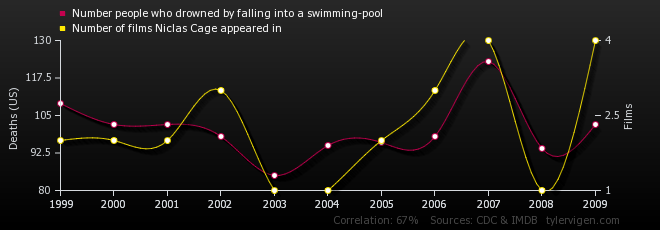
And what about the remarkable correlation between deaths in swimming pools and Nicolas Cage movies? Come on. Surely you now realize that Nicolas Cage movies cause drowning?
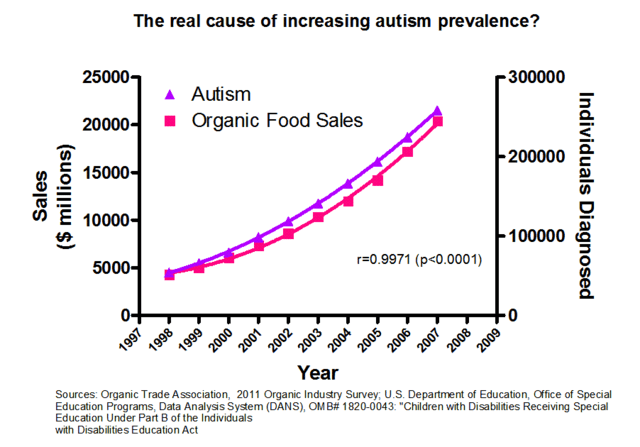
And my favorite: clearly the real culprit behind autism is the increased consumption of organic food! Look guys the numbers prove it! It’s science!
(For more of these entertaining but ridiculous correlations see this website.)
As you can see, just because there’s a correlation between two things doesn’t mean the one causes the other. There may be a third factor involved. Think about the ice cream and polio study. Ice cream and polio were correlated because there was a third hidden factor the study ignored (the summer) contributing to both. Statisticians call a third hidden variable a confounding factor. Or sometimes you can wind up with a correlation like the Nicolas Cage vs. drowning thanks to sheer luck of the draw — random chance.
2) Data dredging.
Data dredging is a problem in medical research. Let me make up a totally hypothetical example to show you how this works. (And be forewarned I’m going to make this as ridiculous as possible.)
Let’s say you select a random sample of one thousand people and do a survey with two questions: 1) have you seen a Nicolas Cage movie in the last 365 days and 2) as of this moment on a scale from one to twenty how intense is your desire to drown yourself in a freshwater pool? (That freshwater part is important, I think.) Let’s say the average desire for drowning of the Nicolas Cage watchers was 12 while the average desire for drowning of the non-Cage watchers was 10. So people who watched Nick Cage were 1.2 times more likely to want to drown themselves! OMG! But wait… I just randomly picked a sample of a thousand people. If I picked a different sample would I get a different answer? How do I know this result isn’t just luck of the draw?
What many researchers in medical science will do is calculate a p-value. The best way to explain this is with a picture. 
In most human populations, many traits will follow a kind of bell-curve distribution like the one above. In our Nicolas Cage example, let’s say the desire for drowning is on the x-axis and the number of people with that expressed desire is on the y. We’re assuming that if you went through the whole population and graphed how many people had a desire for drowning of say 8 or 9 or 10 etc., you’d end up with a bell-shaped curve like the one shown with the same average seen in our non-Cage watching group. So the p-value is calculating, if there is no difference between Cage and non-Cage watchers, if watching Cage really makes no difference, what is the chance of accidentally drawing a sample with an average desire to drown of 12? In other words, could we by chance have drawn a sample up near the far end of the bell curve?
Medical science researchers have arbitrarily chosen a cutoff for the p-value of 5% or 0.05. In other words, if the difference between group A (people who eat meat, people who watch Nicolas Cage, people who work with chemical Y etc.) and group B is big enough the p-value is less than 5% we say “this difference is statistically significant”. This has become a time-honored convention but it suffers from some obvious problems. For one, think about that 5% chance for a minute. It sounds small but really it’s not. If I do a whole bunch of studies with random samples of the exact same size and I do them all the same way, the odds are I’ll get at least one result that looks statistically significant but really isn’t. I’ll get a result that looks significant but was really just caused by luck of the draw.
This is why data dredging is a problem. Some folks will go through datasets and do multiple p-value tests for multiple possible correlations. So they’ll test to see whether Disease X in their sample is correlated with consumption of A or B or C or….and, well, the more of these statistical tests you do, the more likely it is you’ll come up with a result that looks significant but was really just caused by chance. Once they find a result they report it without bothering to mention in the paper “we tested for twenty different correlations and this is the only one we found”. If you’re going to use multiple tests like that you need to use a p-value threshold much lower than 5%, but because 5% has become The Convention We Use in Medical Research some folks will do this anyway. It’s difficult to know how common this problem is because typically the papers that did this don’t say they did it. Which is sort of frustrating.
Which brings me to our next problem…
3) Small sample sizes.
Sample sizes are important for many reasons. For one thing, in a bigger sample you can detect smaller differences more reliably. A difference of 2 in our Nicolas Cage desire-for-drowning study probably wouldn’t give us a p-value less than 5% if our sample size was 6 (this goes back to the way p-values are calculated). If the sample was much larger and the averages were still the same, however, this would be a significant result. So you need big samples to detect small differences.
Remember how with Nicolas Cage we assumed the average desire for drowning in our sample was also the average for the whole population? Right. Well, that’s only going to work if our sample is big enough and was truly randomly selected. With small samples, there’s a much worse danger of ending up with a nonsense result that looks significant but will not be true in other samples. When you see a study that makes conclusions about the general population based on a correlation in a very small sample….be cautious.
It’s a little like if I flipped a coin twice and came up with tails both times. WOuld that prove it was weighted? No, it wouldn’t. If I flip it a hundred times and I get 90 tails, though — now that’s a lot more interesting.
On a related note, it’s also important that the sample look like the population you want to study. Many (if not most) psychology studies, for example, use college undergrads because these studies are done by folks on university campuses, and, well…finding undergrads on a university campus is easy. But does a sample of undergrads really represent the general population?
4) Assuming that a small p-value means your hypothesis is correct.
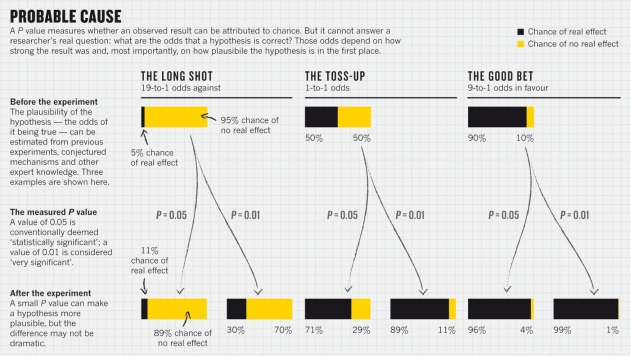
The p-value does NOT tell you the chance that a hypothesis is false or true. There’s a lot of confusion on this unfortunately, even among scientists who should know better. This graph below from a Nature article about why p-values are a flawed way of testing results illustrates why.
5) Small effect sizes.
The “effect size” is the difference between your two groups. With the Nicolas Cage and drowning study, for example, the effect size was 2 or 20% (the Cage watching sample had on average a 20% greater desire to drown themselves).
All too often, people act like a small effect size means a lot more than it does because it’s “statistically significant”. A result can be statistically significant and yet still be meaningless because the effect size is so small. If I invented a drug that increases average life expectancy by thirty minutes if taken every day for the rest of your life…would you take it? If I told you the average IQ of all Californians was 0.05 points higher than the average IQ of all Arizonans…does that really mean Californians are smarter?
6) Generalizing about a group based on the average for that group.
Unlike the other five ways to misuse statistics on the list, this isn’t something you see in scientific papers very often, but in the popular press…it’s all over the place.
Take this article from WebMD for example about supposed differences between men and women; I selected this randomly from a quick Google search. (You should know BTW before I say anything else that some of the research in this article is hotly disputed, although the article curiously forgets to mention that. In fact this article is a wonderful example of how to disguise unproven stuff as hard science.) The article repeatedly says things like “girls outperform boys in” or “boys generally demonstrate superiority over female peers in”. But what they’re really saying is “in this one study that has not been reproduced we found there was a difference on average between girls and boys. The effect size was so small it was meaningless. Also, we’re going to assume correlation = causation and assume therefore that this difference which may or may not even exist in other studies is genetically based because that plays to our pre-existing bias.”
See how much fun it can be to lie with statistics? But my real points here are these. First, most of the time this article doesn’t give you the info you need to evaluate, it just says “this is the way things are”. (How big was the sample size? The effect size? Has the study been reproduced with another sample? how was the study designed etc.) Just as important, it makes generalizations about a group based on an average. If I tell you that Californians are on average smarter than Arizonans, does it follow that any Californian you meet is smarter than any Arizonan? Of course not. There are undoubtedly some Arizonans who are smarter than many Californians. The difference in IQ that we’re talking about is an average. But many popular press articles will take average differences between groups and assume they apply to all members of that group. They will say, for example, that “women are more like x” or “Californians are more like Y” when what they mean is “on average in this one study women were more like X or Californians were more like Y”. It’s extremely important to remember everyone is an individual. People are not walking averages.
So…how can we ever know whether a correlation really is causation? How do we figure out?
First, try to rule out all possible confounding factors. A good study will look for possible confounding factors and try to correct for them or rule them out. If the polio and ice cream people had bothered to ask whether summer was a possible confounding factor (a hidden third variable that causes both A and B so A and B look like they are correlated) they would have solved their problem.
Second, if you’re dealing with a sample, say a randomly selected group of people, try another sample and see if your correlation still holds true. In other words, is this reproducible? This is perhaps the most important thing to do.
Third, try to think of a way the first thing could cause the other thing to happen and devise an experiment to test that. Let’s say you find a correlation between consumption of a specific chemical and cancer rates. If the structure of the chemical is such that any chemist can tell you it will react with DNA, or if you can show it causes mutations in cells in a petri dish (the Ames test), or if you feed it to mice and they unfortunately turn up with cancer, or if you can show that liver cells in a test tube will convert it into a known or likely carcinogen, now you have a really strong case that your correlation really is causation, because now you can show the chemical probably is causing the correlation seen in your study: its chemical/biochemical reactivity shows you it’s doing what the correlation suggests it is. Unfortunately for many disorders like Alzheimer’s where no one has any idea what’s going on biochemically to cause this disease that’s not yet possible.