Over the last few decades, Computer Science has become more prominent in finance and economics. Leading financial institutions are utilizing computers to produce outcomes. For instance, JP Morgan, Chase, and Barclays rely on supercomputers to assess a stock portfolio’s risk or forecast an asset’s future worth. How is this accomplished?
In this article, I will examine how computers assess sentiment and apply machine learning to optimize investment returns.
## Sentiment Analysis
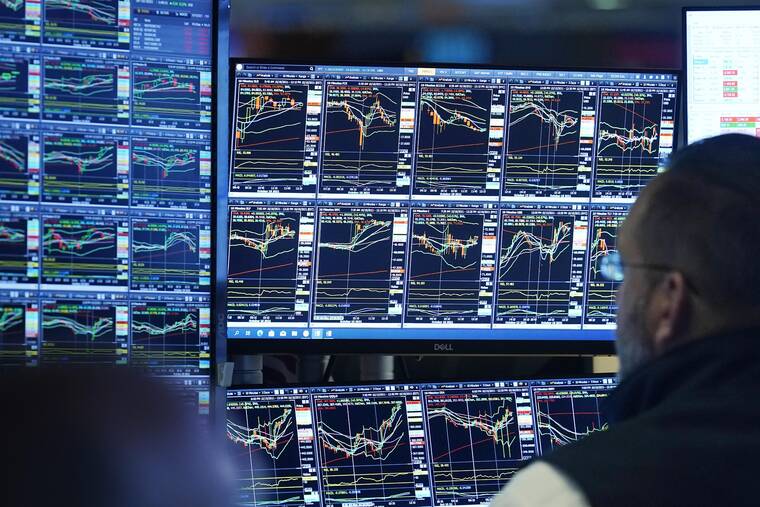
The market has transitioned from instinct-based investing to trusting computer programs. The era of traders hurriedly buying and selling stocks on trading floors is fading. Replacing these floor traders are quantitative analysts, or quants for short. Quants create computer algorithms with a strong focus on mathematics to execute trades and predict a stock’s future performance.
Acknowledging this market shift, Dow Jones has developed a lexicon to enable computers to efficiently analyze stock movements. Another term for lexicon is dictionary. The Dow Jones Lexicon (DJL) compiles financial news and translates it into a format that computers comprehend. Additionally, the DJL comprises six distinct dictionaries, all developed by Bill McDonald, a finance professor at the University of Notre Dame. Nonetheless, financial firms are allowed to design their own dictionaries to meet specific requirements.
When a computer possesses a lexicon, it can differentiate between positive and negative news. This helps inform traders whether it’s prudent to make a trade for a particular stock.
Let’s scrutinize a news article to see how the sentiment lexicon functions. This article is from CNBC and was published on November 26, 2021, shortly after scientists in South Africa detected a new variant of COVID.
This is the opening line of the article. You will observe that one of the initial words is “dropped.” A computer reviewing this text segment would classify it as negative and lower the sentiment score, suggesting that the stock market trend is bearish. However, the positioning of the word is also crucial. Keywords found in headlines or the opening lines carry more significance in the sentiment score than if they were embedded within the body of the text.
In this screenshot, words such as “down,” “dropped,” “lost,” and “fell” can be seen. These are terms that the computer will recognize as negative, consequently reducing the sentiment score.
So, what does this process look like on the computer side? It turns out to be a fairly straightforward procedure. Developing a sentiment analysis program is done through XML code. XML stands for extensible markup language and is closely tied to HTML, although it is not an independent language. HTML describes the formatting of a document while XML delineates the data contained within the document. For instance, in HTML, there are tags which a programmer includes to create specific objects. For example, the `
` tag denotes a heading on a website (h for heading; 1 indicates the first heading). In contrast, XML enables programmers to further customize their code. Rather than employing a broadly defined `
` tag, XML permits the designation of tags like “ to clarify what is being defined. This streamlines code interpretation and customization to suit business needs.
“`xml
White
Blue
Black
Green
Red
Apple
Pineapple
Grapes
Melon
“`
In the illustration above, quants or traders would utilize a similar format as shown, simply adjusting the tags to match an algorithm for sentiment analysis.
Sentiment analysis merely scratches the surface of what computers can achieve on Wall Street. While I cannot cover everything, I will proceed with the article by addressing how Machine Learning plays a role in predicting market movements.
## Machine Learning
Machine Learning (ML) is a subset of Artificial Intelligence (AI) that gathers information for systems like Siri to aid in decision-making. In this context, rather than Siri, it’s computer algorithms.
To maximize the likelihood of success, the computer must undergo a training phase. Four characteristics of stocks are employed for training: its opening price, the day’s high, the day’s low, and trading volume. The following data pertains to Microsoft stock.
| Date | Open | High | Low | Close | Adj Close | Volume |
|————|———|———|———|———