The word map in modern English is taken from the medieval mappa mundi, whereby the term mappa is the Latin for napkin, cloth, table cloth on which these philosophical representations of the Medieval world were first drawn or painted. In general, maps were representative pictures that expressed in some way the possessive concept of ours, we belong here, or mine, I rule over this. Whilst often reasonably recognisable as representations of the areas they depicted they weren’t particularly accurate. Although early cultures often had methods of surveying, these were mostly only used for depictions of comparatively small areas. The Ancient Greeks, most notably Ptolemaeus, introduced the concept of applying measurement and coordinates to make maps more accurate. However, it was first in the Early Modern Period that the strict application of mathematics to surveying and mapmaking became the norm. So it is that we now think of maps as a mathematically correct depiction of the world in which we live.
In the first place, we think of maps as something geographical but the term mapping has been extended over the centuries to cover the mathematical depictions of various aspects of the world in which we live. In her book, Mapmatics: How We Navigate the World Through Numbers[1], Paulina Rowińska, self-confessed lover of maps and a mathematician, who has a PhD in Mathematics of Planet Earth, takes he readers on a step by step historical journey through how different branches of mathematics came to describe different aspects of the world and explains in layman’s terms the methodology of how they do it.
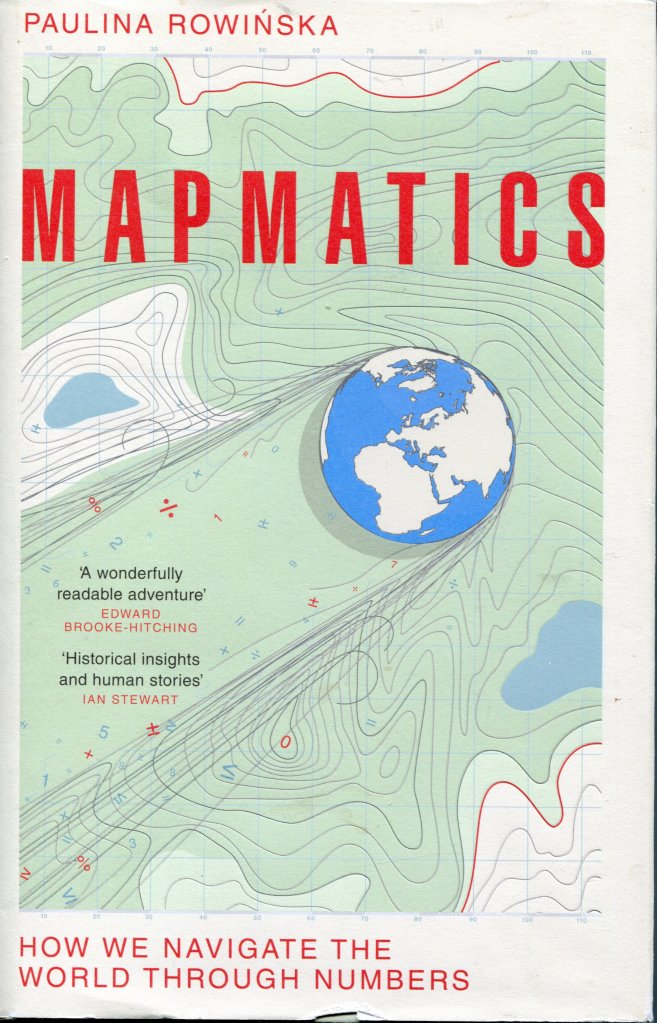
In the introduction Rowińska explains how she fell in love with cartography the first time she saw a globe and then how she later became aware that it is mathematically impossible to make a flat map of the Earth, a sphere. The first chapter of her book, Curved: How to Describe the Earth, takes up this theme and the mathematical problems inherent in projection, the process of turning a curved surface into a flat one. We get to meet to Gemma Frisius (1508–1555), who introduced triangulation, which enabled large scale accurate surveys, into the world of cartography and Carl Friedrich Gauss (1777–1855), who used triangulation to survey the Kingdom of Hanover, and, more significantly, proved that you can’t project a curved surface onto a flat sheet of paper without distortion.
Unfortunately, in this opening chapter, Rowińska drops the only major historical clangour that I detected in her book. She tackles the debate that started in the late seventeenth century as to whether the earth is an oblate or a prolate spheroid–grapefruit or egg shaped is how Rowińska describes it. She explains that it became a political dispute with the French supporting the Cartesian egg shape and the English the Newtonian grapefruit. This is already historically false, as the grapefruit shape was also propagated by Christiaan Huygens (1629–1695) the leading Cartesian philosopher of the period. She then correctly introduces the decision by the French Academy of Science to settle the argument empirically by measurement. Her source for this section is Larrie D Ferreiro author of Measure of the Earth: The Enlightenment Expedition That Reshaped Our World (Basic Books, 2011). She produces a relatively brief version of Ferreiro’s account of the expedition to the equator in Peru to measure one degree of longitude with all of its trials and tribulations. Then says that the result compared with the determination one degree of longitude of Jean Picard (1620–1682) for Paris, he doesn’t get a name check at all, showed that Newton was right. However, Rowińska doesn’t appear to be aware that there were two expeditions, one to Peru and one to Lapland, and it was the comparison of these two results that confirmed that Newton and Huygens were correct.
The succeeding chapter, Flat: How to Make a Map, takes us from the curved Earth to the flat sheet of paper and the world of map projection. This chapter is centred around the work of Gerard Mercator and his famous, or as Rowińska explains, in our times, infamous, projection. I must admit I was somewhat surprised, or maybe disappointed, that Ptolemaeus (fl 150 CE), who basically introduced map projection into the world and whose rediscovery in the early fifteenth century led in an almost straight line to Mercator and his work, doesn’t even get a mention. Mercator actually spent a lot of time and effort production a new edition of Ptolemaeus’ Geographia, as the first volume of his atlas.
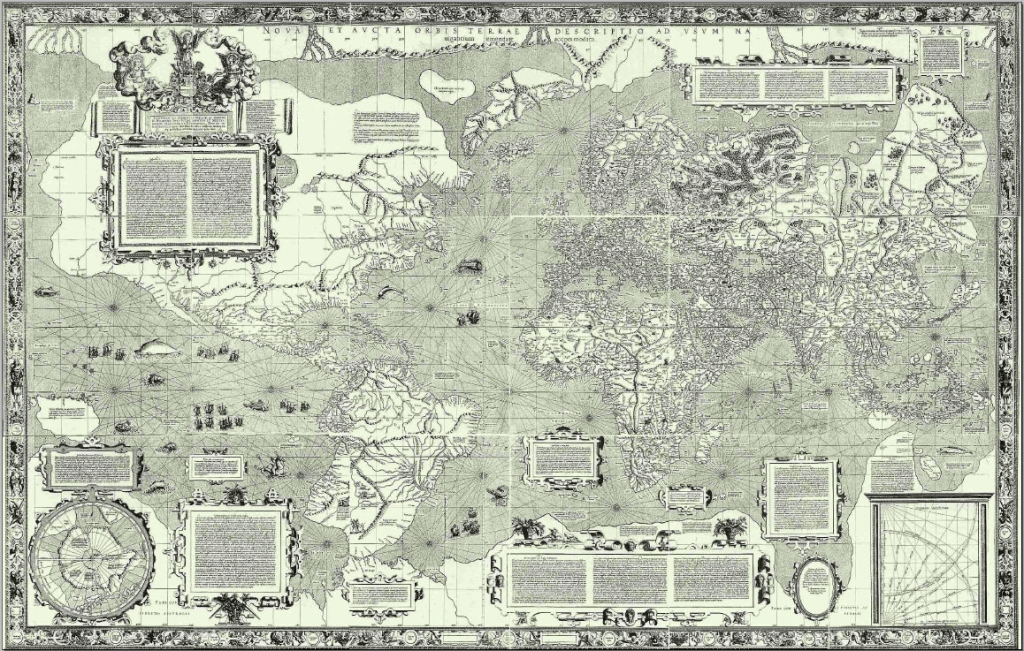
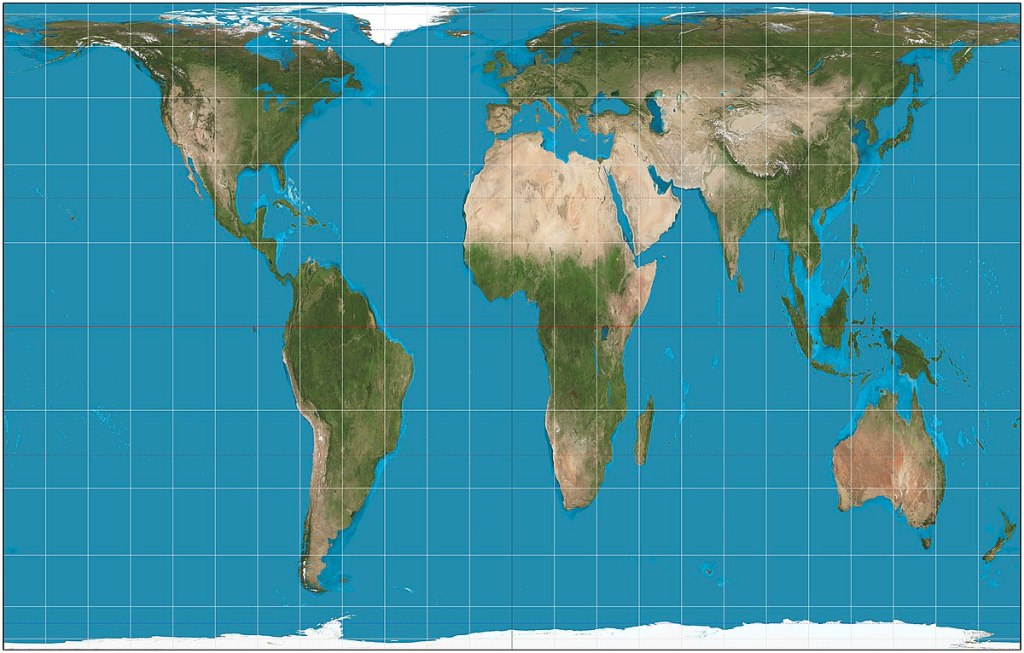
She first explains the geometry of the various basic types of projection, before going on to the genesis of Mercator’s, Made for Navigation, map projection that through no fault of its own became the standard, ubiquitous world map that hung on so many classroom walls. She then takes the reader through the, not so easy, maths of the Mercator projection and the history of how other people had to derive it, because Mercator never explained how he did it. We then move on to a discussion of the area distortion inherent in the Mercator projection and the discussion that flared up in the second half of the twentieth century about how it discriminated against the southern continents and the third world. This leads to a discussion of the famed, proposed alternative Peters projection and the various other attempts to save the situation. The detailed presentation of this discussion is excellent and I loved cartographer Arthur H. Robinson’s comparison of the landmasses on the Peters projection to “ragged, long, winter underwear hung out to dry on the Artic circle.”[2]
Leaving the controversial world of map projection in her third capital, Scaled: , Rowińska introduces her readers to another problem inherent in all mapmaking, How to Measure a Line. After a discussion of the concept of scales in mapmaking, Rowińska introducers her readers to the problematic fact that the length of lines on a map, borders or coastlines for example, vary massively depending on the scale that is used to represent them, this is the measuring stick used to measure them. She tells us:
We call this phenomenon of measurements’ dependence on the measuring stick’s length the coastline paradox.[3]
She takes her readers through the historical discovery of this paradox and then on to Benoit B. Mandelbrot (1924–2010) and his discovery/invention[4] of fractals the mathematics behind the coastline paradox. Having explained the mathematics of fractals, Rowińska takes a look at some political disputes that arose because of the coastline paradox.
Chapter 4, Distanced: How to Navigate, opens with a discussion of London’s iconic Tube Map.
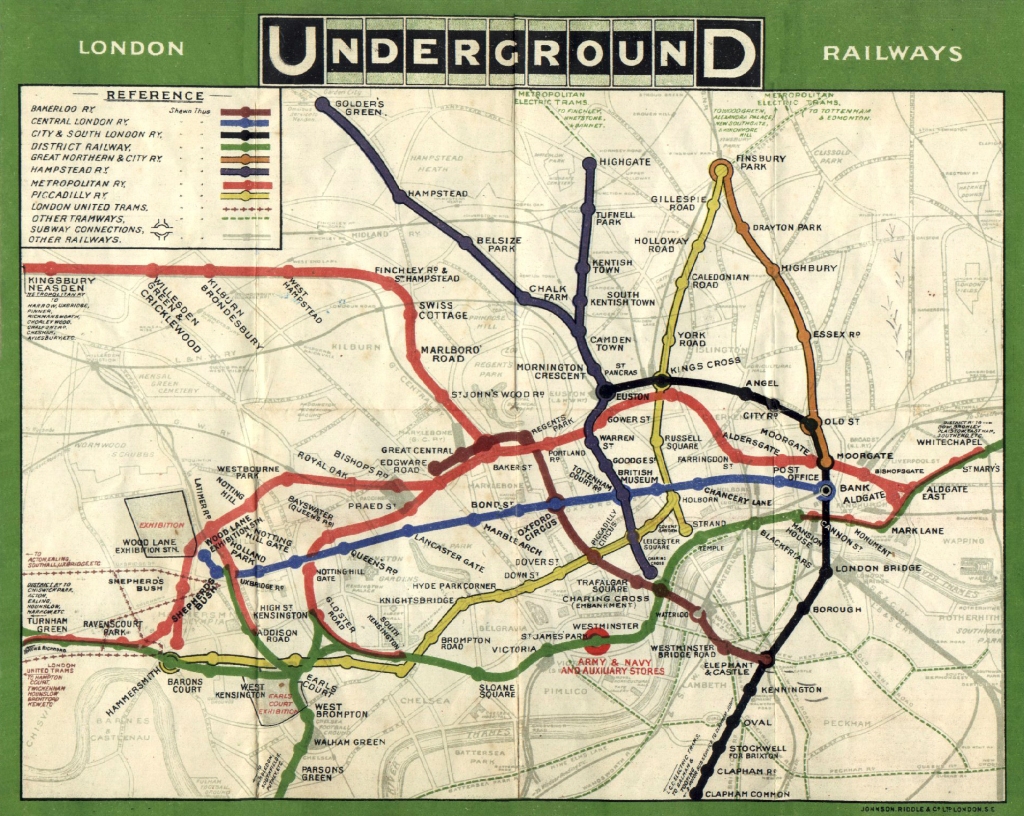
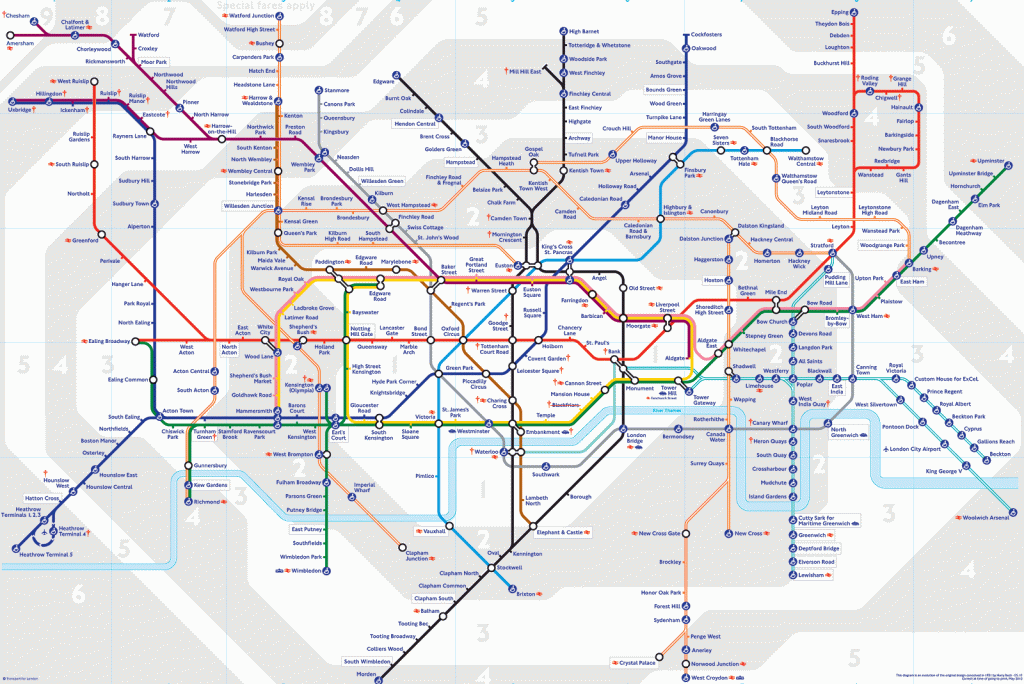
Rowińska introduces the discipline of topology and explains that the Tube Map is a topological map, that is it keeps the properties crucial for commuters, the connections and the order but ignores factors such as distance or the real geographical positions of the stations. She explains the history of how this iconic map came to be created and outlines the advantages and disadvantages of such a topological map. Rowińska also introduces a fascinating topological map produced by the Native American, Catawba peoples in c. 1724.
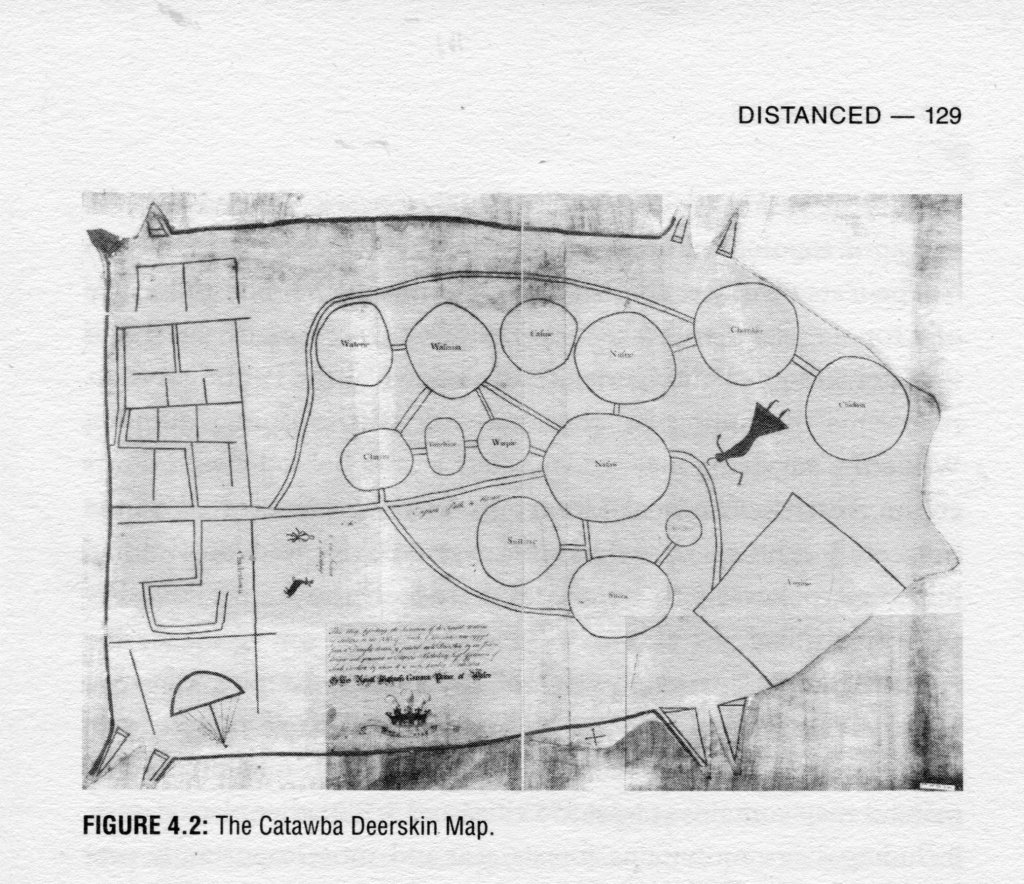
She points out that the even older Peutinger road map of the Roman Empire is another example of a topological map. Moving on, Rowińska takes a look at urban street maps and the mathematics of distance between points and the different ways of measuring them, knowns as metrics in mathematics.
Chapter 5, Connected: How to Simplify a Map, stays in the discipline of topology and opens with Leonhard Euler (1707–1783) and the famous Seven Bridges of Königsberg problem. Unfortunately, she starts with a somewhat inaccurate statement:
AN ALMOST COMPLETELY BLIND [emphasis in original] father of thirteen, Swiss-born and Russia Empire-based Leonard Euler wasn’t the most likely candidate to become one of the most prolific mathematicians in history.[5]
That opening four word blast is a misleading oversimplification of one of the most fascinating stories in the history of mathematics. In 1738 following illness, Euler almost lost the sight in his right eye but retained that in his left eye. First in 1766, he began to lose the sight in his left eye due to a cataract. Through couching of the cataract, he regained the sight in his left eye but over time it deteriorated and he final became almost totally blind. He continued to work in his head dictating his work to scribes.
Rowińska tells the story of the Seven Bridges of Königsberg problem and how Euler approached the problem by stripping the map of Königsberg of all of its details and reducing it to just the river and the bridges.
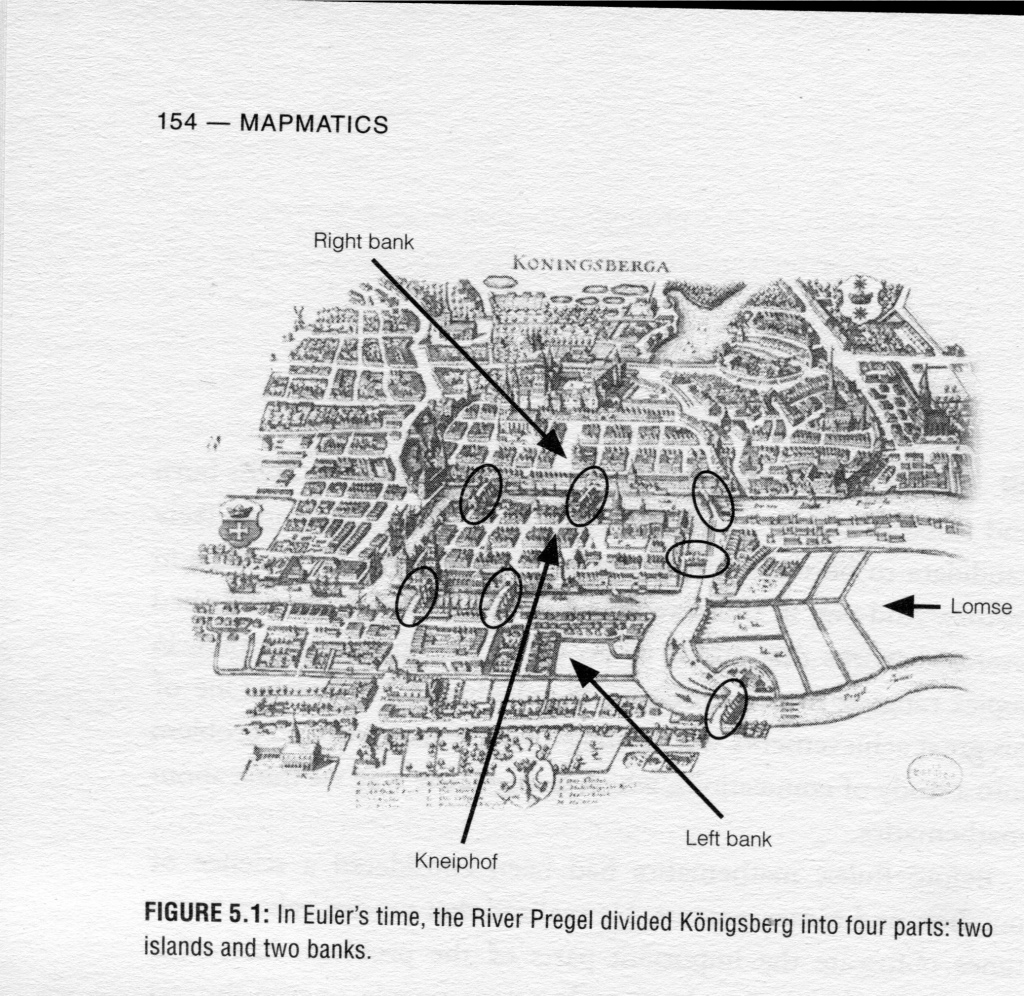
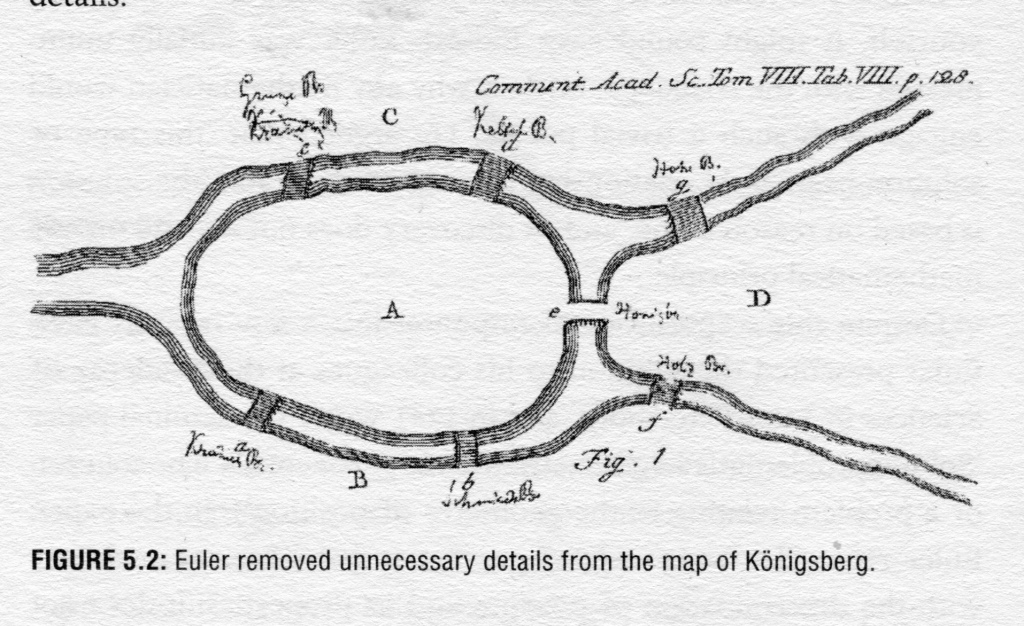
He had created what is now known as a graph.
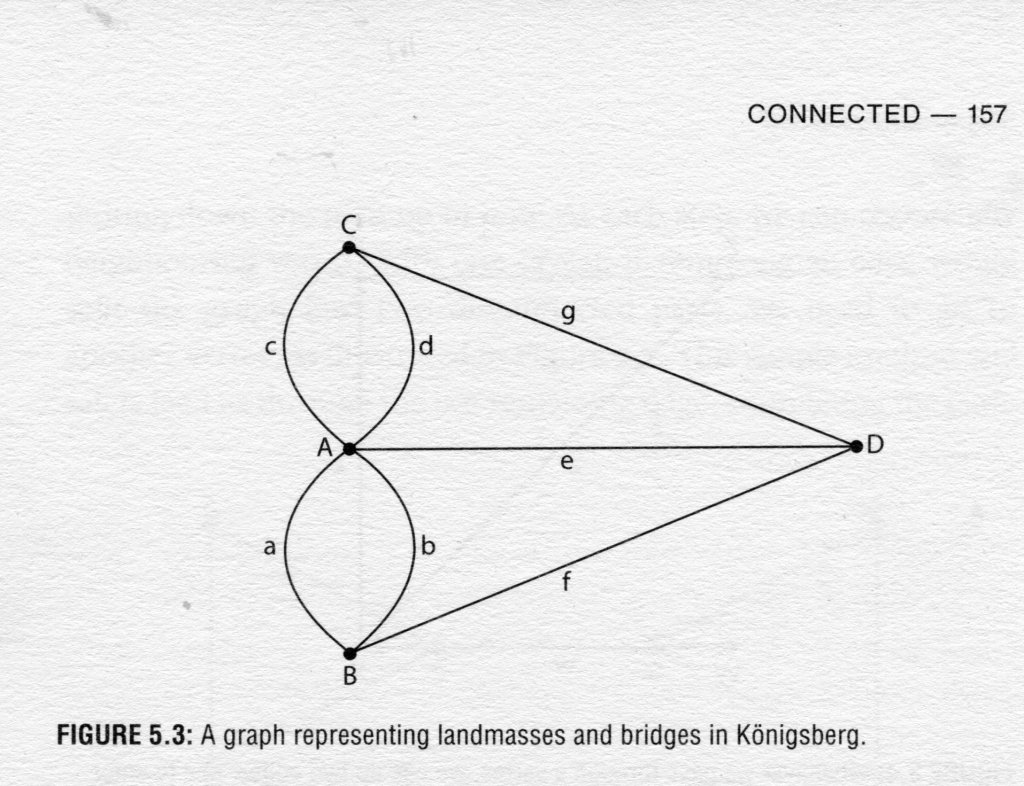
Rowińska now takes her readers into the world of graph theory and the travelling salesperson problem, how to work out the most efficient delivery route for a given number of destinations. She goes into great detail on the various methods to find approximate solution to the problem since the middle of the twentieth century. Moving on we have the equally famous four colour map problem that was also solved through graph theory as Rowińska explains. She ends with a discussion of what constitutes a proof provoked by the computer based solution to the four colour map problem.
Chapter 6, Divided: How to Shape Society opens with a discussion of the hot political topic, gerrymandering; how politicians divide up electoral districts to ensure that their side wins an election. Rowińska deals with the history of gerrymandering in American politics and then takes her readers on a tour of the mathematics of dividing up geographical areas into electoral districts to achieve either a biased or a fair vote.
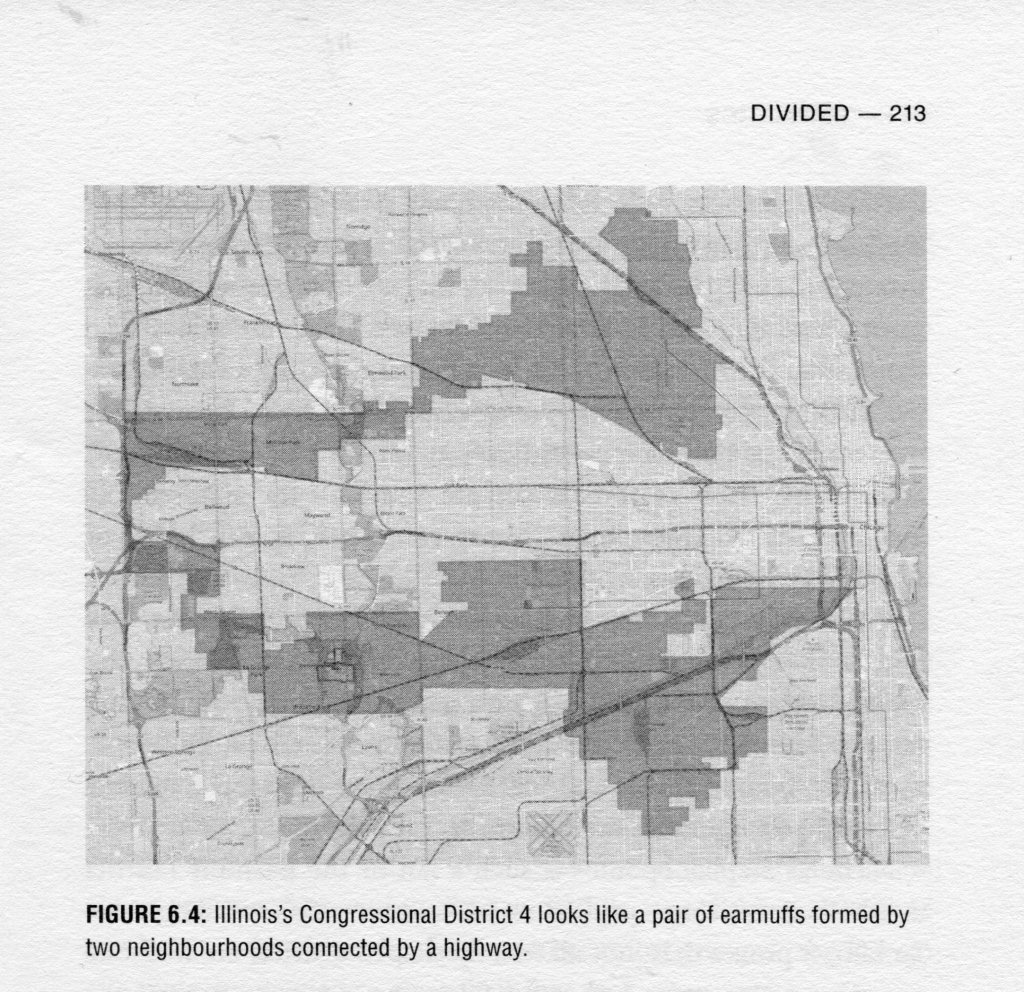
It’s a more than somewhat complex topic and she goes into it in depth. Following American electoral districts, we have American school districts another thorny area in everyday American social politics.
Chapter 7, Found: How to Save a Life, once again takes on a legendary story of mapping, how the doctor John Snow stopped a cholera epidemic in nineteenth century London. Rowińska takes us through the history of the nineteenth century cholera epidemics in the UK and the well known story of John Snow and the Broad Street pump. How he located the source of the outbreak by mapping the occurrence of the cases.
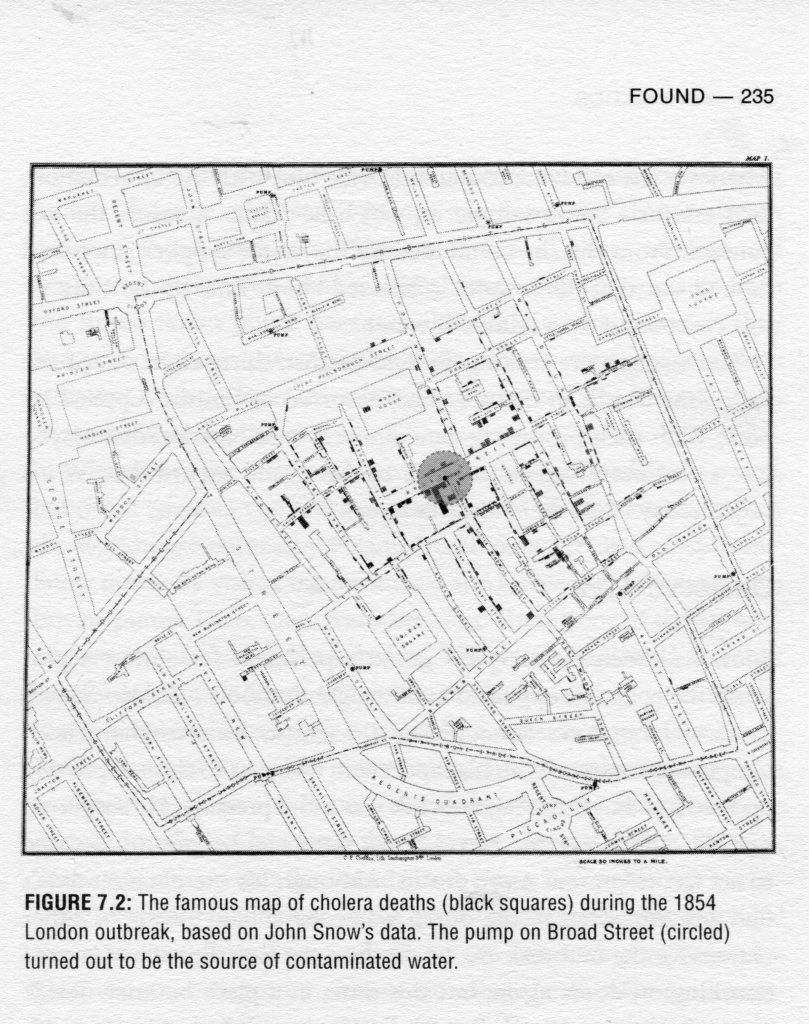
She then takes the trouble to separate the myths from what really happened to show that Snow was not quite the super-efficient hero that he is usually presented as. Having dealt with the beginnings of epidemic mapping, Rowińska now takes her readers on a tour of the subject of geographic mapping of disease and its importance in the modern world. She then explains how the same methodology can and is used to fight crime or to find a missing airplane.
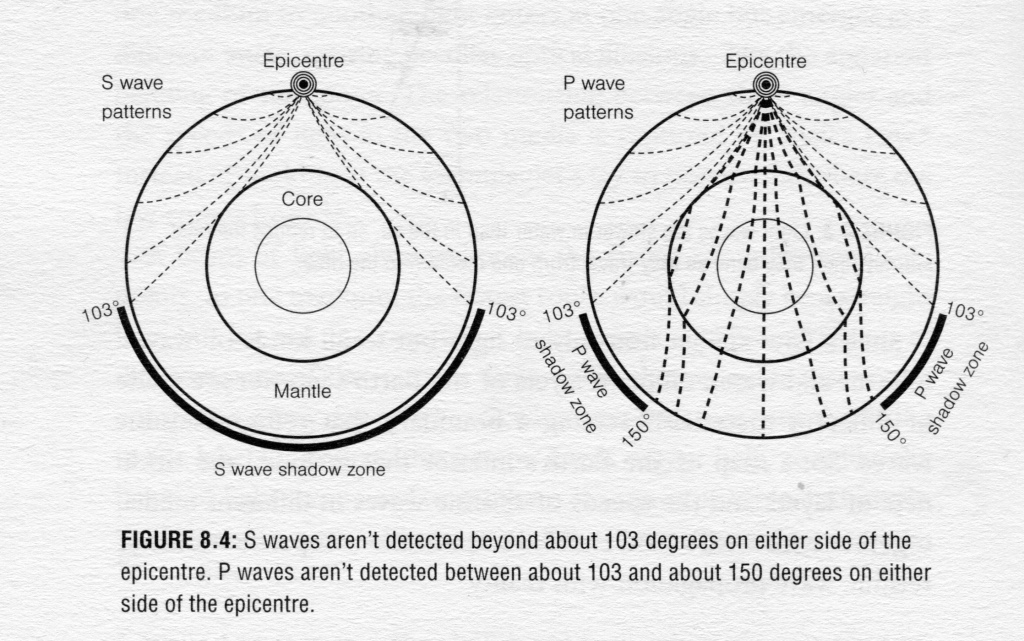
The final chapter, Deep: How to Map the Invisible is the one I probably enjoyed most as it delt with a topic of which I was previously totally ignorant, mapping the oceans using sonar and the interior of the earth using seismographs. It is truly fascinating to learn about the problems that have to be surmounted and the methodology that has been developed to map those parts of the earth that simply can’t be seen.
As far as notes are concerned the book has the worst of all option, what I term hanging endnotes, that is endnotes that aren’t referenced in the text. You read something interesting and then go a look to see if maybe there’s a note about it. Please publisher, get read of this abomination. The notes themselves are mainly to sources. There are short biographies for each chapter at the end of the book and an adequate index! The book is illustrated with a limited number of black and white diagrams and occasional maps.
As is often the case, my blow by blow account of the individual chapters doesn’t even come close to describing the large quantity of material packed into this volume on the different ways of mapping the world and human existence. Rowińska writes in a pleasant almost chatty style, sprinkled with personal anecdotes. Reading her book, I got the feeling of sitting in a comfortable coffee shop chatting to someone whose passion for maps and mathematics spilled out in a torrent of fascinating twist and turns. Definitely a book for a wide general audience of readers if they are prepared to put in the work to understand the mathematics of mapping in its numerous variations.
[1] Paulina Rowińska, How We Navigate the World Through Numbers, Picador, 2024
[2] Rowińska p. 64
[3] Rowińska p. 93
[4] Choose your preferred term according to your philosophy of mathematics
[5] Rowińska p. 153