**The Connection Between Ice Cream and Polio and the Dangers of Misapplying Statistics**
During the 1940s, polio spread through communities with waves of panic, driving parents to extremes to shield their children from a harsh and enigmatic illness. Prior to the introduction of the polio vaccine in 1955, responses varied from everyday hygiene practices to frantic actions based on false information. One of the most peculiar beliefs of the era was a bizarre connection suggested by some public health officials: **consuming ice cream might elevate the chances of getting polio.** This assertion was based on observations of a correlation between increased ice cream sales and surges in polio cases—both of which peaked during the summer months. However, as clearer statistical understanding emerged with time, it became evident that this conclusion fell victim to one of the oldest pitfalls in data interpretation: confusing correlation with causation.
The “ice cream causes polio” fiasco stands as a warning about how incorrect application of statistics can result in harmful or misguided policies. Even in contemporary times, the misapplication of statistical techniques still obscures the clarity of scientific inquiry, healthcare, and government decisions. By recognizing six prevalent errors researchers make while interpreting data, we can become more discerning consumers of information and more capable of distinguishing fact from fiction.
—
### **1. Correlation Does Not Imply Causation**
It’s easy to jump to the conclusion that when two phenomena coincide, one must be the cause of the other. Data revealing that ice cream sales and polio cases peaked at the same time may lead some to speculate that the dessert harbors a nefarious influence. Yet, astute statisticians understand that they need to identify a **confounding factor**, a third element that affects both variables. In this instance, summer acted as that hidden factor. Warmer weather drove the increase in polio cases (as children played outdoors) alongside a surge in ice cream sales.
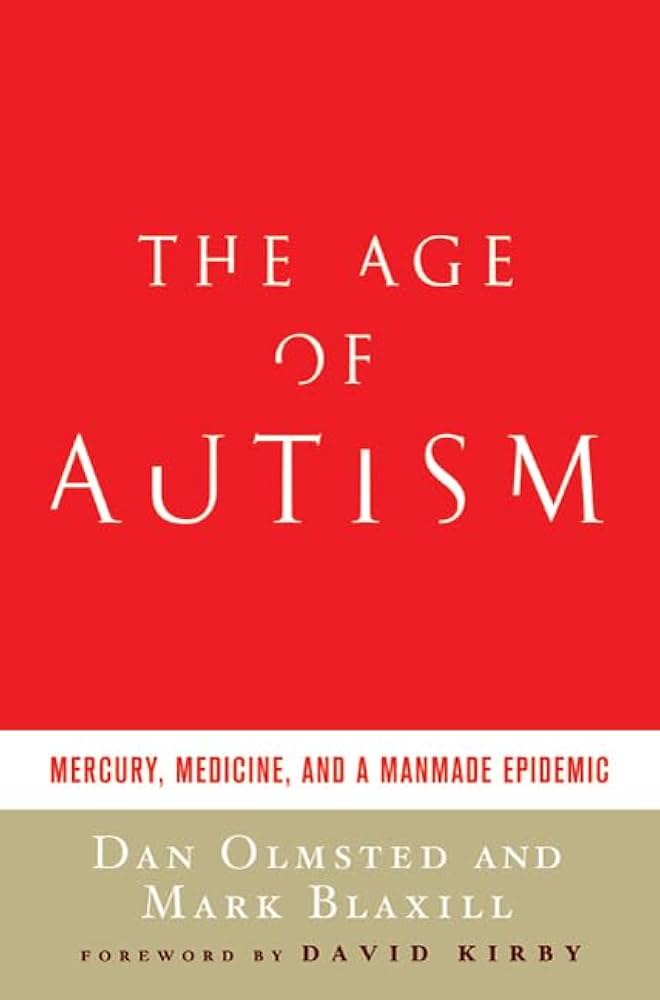
Misinterpreting correlation can lead to outrageous conclusions. An amusing illustration is the “link” between the release of Nicolas Cage films and drowning fatalities in swimming pools, or the equally ridiculous association between organic food intake and autism prevalence. These statistical anomalies entertain us because they are obviously absurd, yet they highlight a serious reality: **correlation devoid of context is without meaning.**
—
### **2. Data Dredging**
Data dredging, also referred to as p-hacking or cherry-picking, happens when researchers comb through extensive datasets, employing numerous statistical tests until they discover something that appears “statistically significant.” The issue is that when multiple variables are tested, it’s likely that one will appear to be significant purely by chance.
Envision surveying 1,000 random individuals and posing a variety of unrelated questions. If one analysis reveals that Nicolas Cage enthusiasts have an abnormally high inclination to drown themselves in swimming pools, should we assert that his movies are perilous? Absolutely not—but experiments conducted in actual scientific settings don’t always follow such coherence. Researchers who cast a broad net without disclosing how many tests were conducted risk presenting false positives as valid findings.
To steer clear of data dredging, researchers need to adjust for multiple comparisons, clearly describe their methods, and implement stricter statistical cutoffs when analyzing extensive datasets.
—
### **3. Small Sample Sizes**
The size of a sample is crucial. A small group might indicate a dramatic outcome, but the findings are far less dependable than those from larger populations. For instance, flipping a coin two times might yield two tails, but does that imply the coin is biased? Certainly not. If you flip it 1,000 times and only see 20 heads, that should raise a red flag.
In scientific studies, small sample sizes increase the risk that random fluctuations will be mistakenly taken for genuine signals. Additionally, researchers must ensure their samples represent the broader population under investigation. Many psychological studies, for example, rely on college students as subjects. While convenient, these groups often fail to embody diverse demographics in age, ethnicity, or background, which complicates the validity of generalizing their findings.
—
### **4. Overreliance on P-Values**
The **p-value** is a commonly utilized statistic for assessing whether a finding is “statistically significant.” When the p-value falls below 0.05 (or 5%), researchers typically infer that the result isn’t due to chance. However, p-values are frequently misinterpreted. A low p-value does **not** automatically validate the tested hypothesis. For instance, if your hypothesis posits that Nicolas Cage fans desire poolside funerals and your p-value is below 0.05, it suggests the outcome isn’t random, but it doesn’t necessarily confirm that Nicolas Cage is the cause—the interpretation largely depends on how the data was gathered and analyzed.
P-values also overlook the **prior probability** of a hypothesis being true. If the original assumption is highly improbable, then a statistically significant result warrants even greater scrutiny.
—
### **5. Neglecting Effect Sizes**
A statistically significant result doesn’t necessarily imply that it is meaningful. The