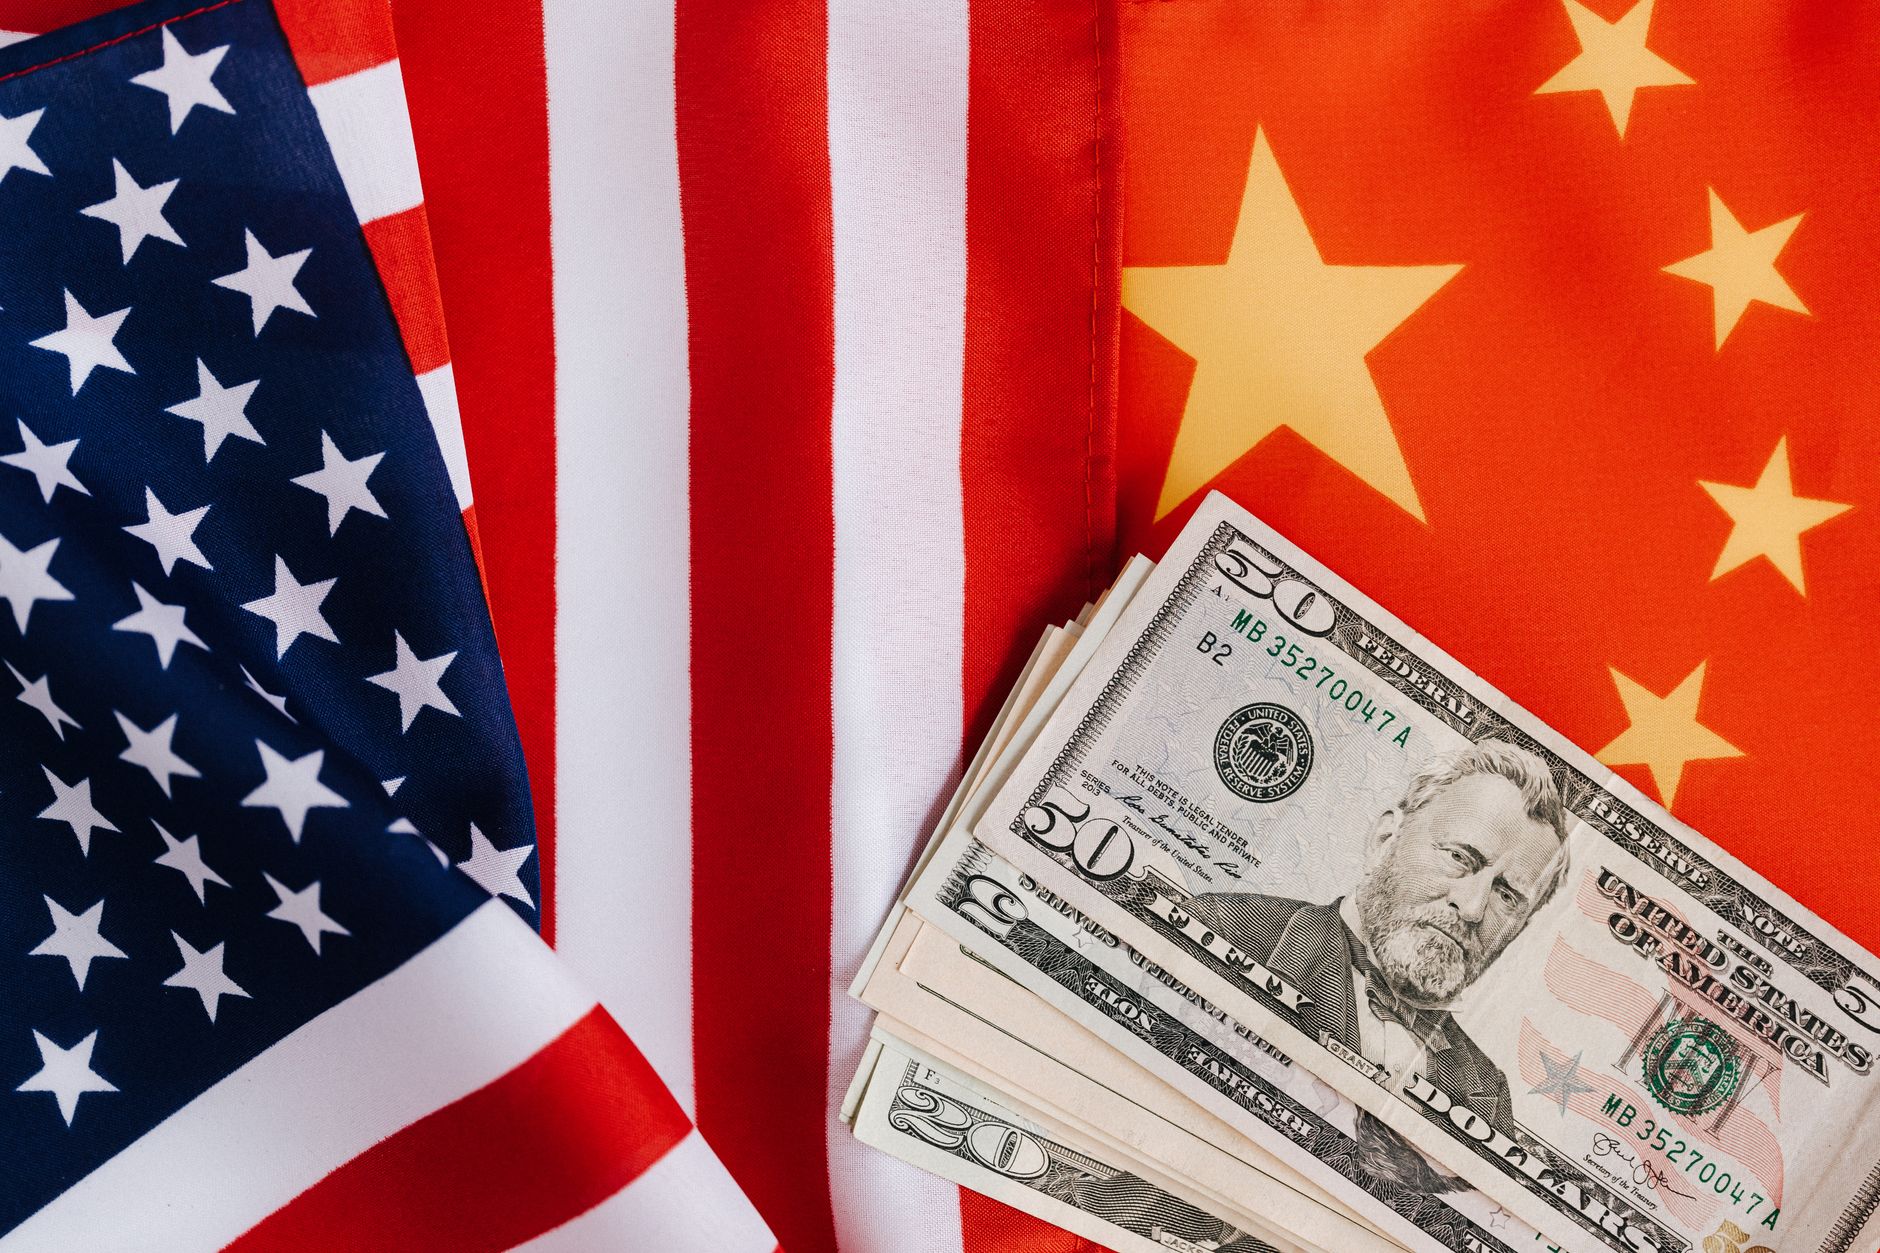
**Stanford’s 2026 AI Index Emphasizing U.S. Leadership in AI Investments and Technical Equivalence with China**
Stanford’s 2026 AI Index provides fascinating revelations about the worldwide AI arena, particularly showcasing the United States’ dominant financial position and the tight technical rivalry with China. The report emphasizes that the U.S. achieved a notable advantage in private AI funding, amassing $285.9 billion in 2025 versus merely $12.4 billion for China. Nevertheless, the technical contest seems significantly closer, with a 39-point margin in the Arena leaderboard between top American and Chinese AI models in March 2026, which the report interprets as a 2.7 percent difference.
**A Significant Private Capital Disparity**
The investment statistics stem from Stanford’s AI Index, leveraging Quid’s extensive database of AI-oriented firms. The United States represented approximately 83 percent of the $344.66 billion in worldwide private AI investments in 2025. While Stanford tracked 28 major AI investment occurrences exceeding $1 billion, including OpenAI’s $40 billion round, China lagged considerably with fewer such financial inflows. This contrast emphasizes the United States’ substantial supremacy in private AI financing, although significantly influenced by large investment occurrences.
**What Investment Figures Omit**
The private investment statistics concentrate solely on funding events involving AI entities, disregarding government-supported financing, which holds substantial weight in China. The report highlights that China’s extensive governmental backing through strategic guidance funds allocated roughly $184 billion to AI firms from 2000 to 2023. Therefore, while the U.S. leads in private funding, the overall national investments channelled into AI might not show as pronounced a difference as the private investment metrics indicate.
**Assessing Technical Performances: The March 2026 Arena Overview**
On the technical side, Stanford’s evaluation uses the Arena leaderboard, signaling a tight contest between the American and Chinese models — Anthropic’s Claude Opus 4.6 and ByteDance’s Dola-Seed-2.0 Preview, respectively. The 39-point disparity signifies a narrow 2.7 percent distinction based on the Chinese model’s evaluation, underscoring a notable technical alignment despite the financial imbalances.
**Understanding the Percentage Difference**
The 2.7 percent difference should not be misinterpreted as a direct indicator of precision or competency. Arena’s ratings are influenced by human preferences, similar to an Elo-like framework, reflecting how competing models are assessed rather than an absolute standard. Elements such as style and presentation may sway preferences without directly linking to intelligence or capability.
**Mismatch between Financial Investments and Ratings**
Private funding contributes more than just prompt leaderboard advancements; it bolsters infrastructure, research, distribution, and potentially future systems. The choice of models for the country comparison illuminates leading-edge innovations but does not necessarily reflect the average technological output or the depth of national capabilities.
**Conclusion: Scale of an Ecosystem versus Competitive Parity**
Stanford’s report clarifies two separate narratives: the vast U.S. private AI investments compared to China and the tight technical performance of AI models from both countries. These insights highlight the intricate dynamics of AI development, where substantial funding and technical prowess may not strictly align. The United States retains a considerable private-investment lead, while the technical gap with China remains narrow, reflecting different aspects of the ongoing AI rivalry.